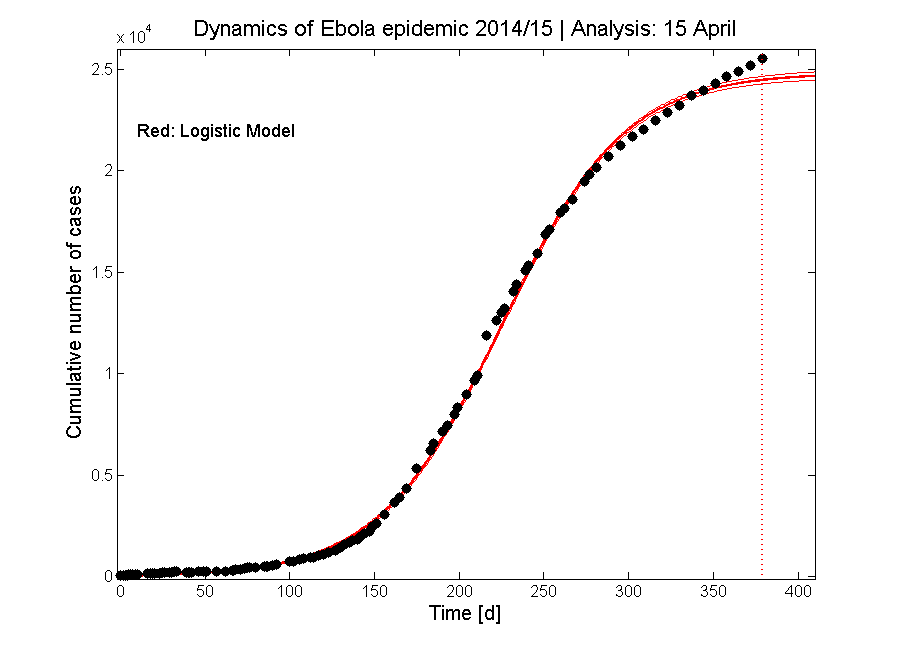
Update #37: 15 April 2015 | New prediction.
→ Deviation from the predicted trend. The almost linear trend since a few months seems strange.
→ Deviation from the predicted trend. The almost linear trend since a few months seems strange.
Update #36: 8 February 2015 | New prediction.
→ The trend of decreasing new cases continues as predicted
→ The trend of decreasing new cases continues as predicted

Update #35: 24 January 2015 | New prediction.
→ Correct precition based on the analysis from 16 January. The number of cases are decreasing fast and faster; the Ebola outbreak seems to be over in a few months
→ Correct precition based on the analysis from 16 January. The number of cases are decreasing fast and faster; the Ebola outbreak seems to be over in a few months

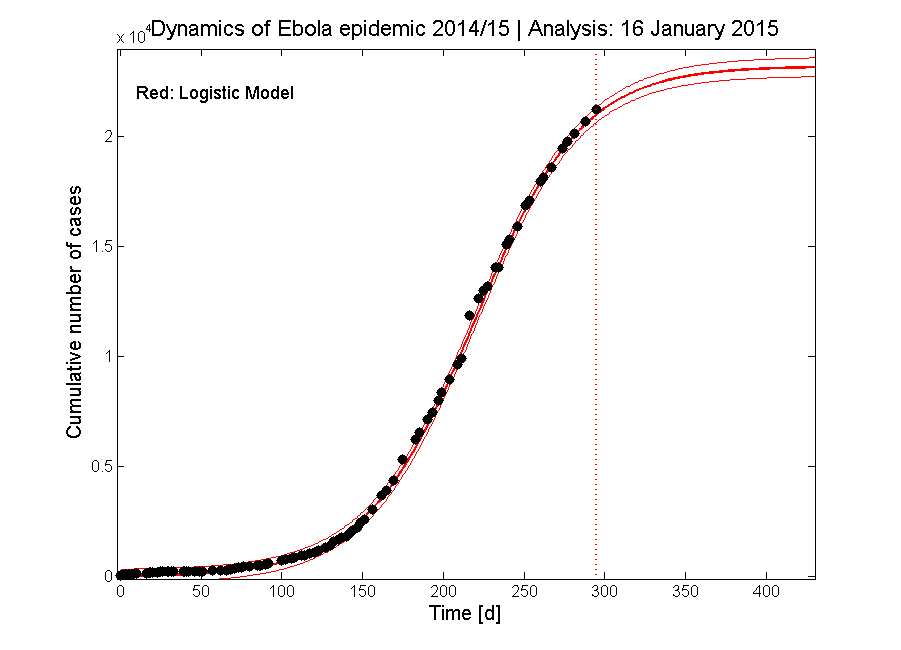
Update #34: 16 January 2014 | New prediction.
→ Predicted maxium: Mai 2015, max. cases: 23000 +. 500.
→ Predicted maxium: Mai 2015, max. cases: 23000 +. 500.
Update #34: 8 January 2015 | New prediction.
→ Good agreement between new data and previous prediction.
→ Good agreement between new data and previous prediction.

Update #33: 31 December 2014 | New prediction.
→ The fitting with the IDEA doesn't give good results anymore. A better fit is obtained with a logistic function. Predicted maxium: Mai 2015, max. cases: around 23000. The rate will significantely slow down in the next few months.
→ The fitting with the IDEA doesn't give good results anymore. A better fit is obtained with a logistic function. Predicted maxium: Mai 2015, max. cases: around 23000. The rate will significantely slow down in the next few months.

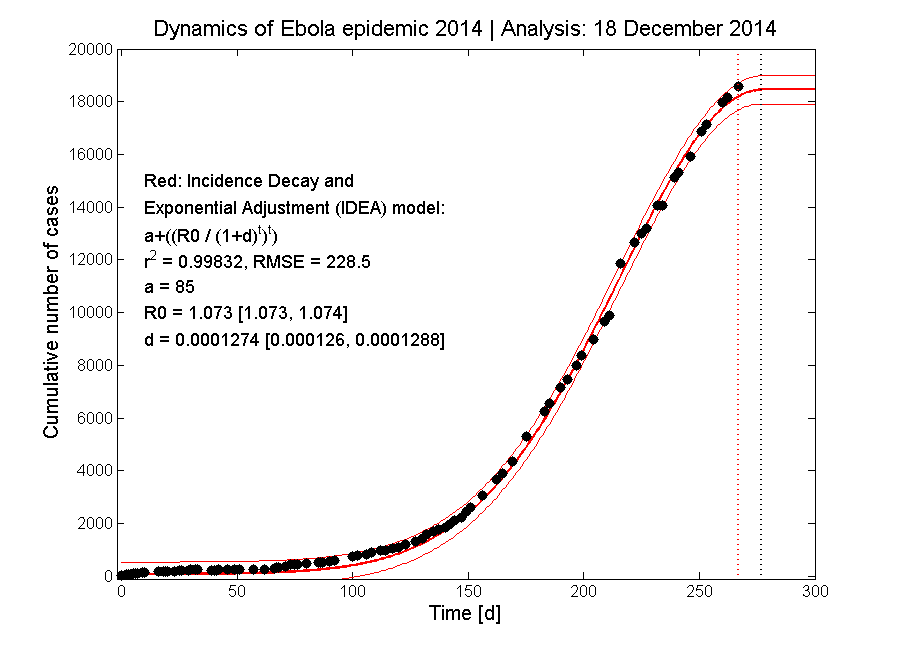
Update #32: 18 December 2014 | New prediction.
→ Predicted maximum: January 2015, max. cases: around 19.000.
→ Predicted maximum: January 2015, max. cases: around 19.000.
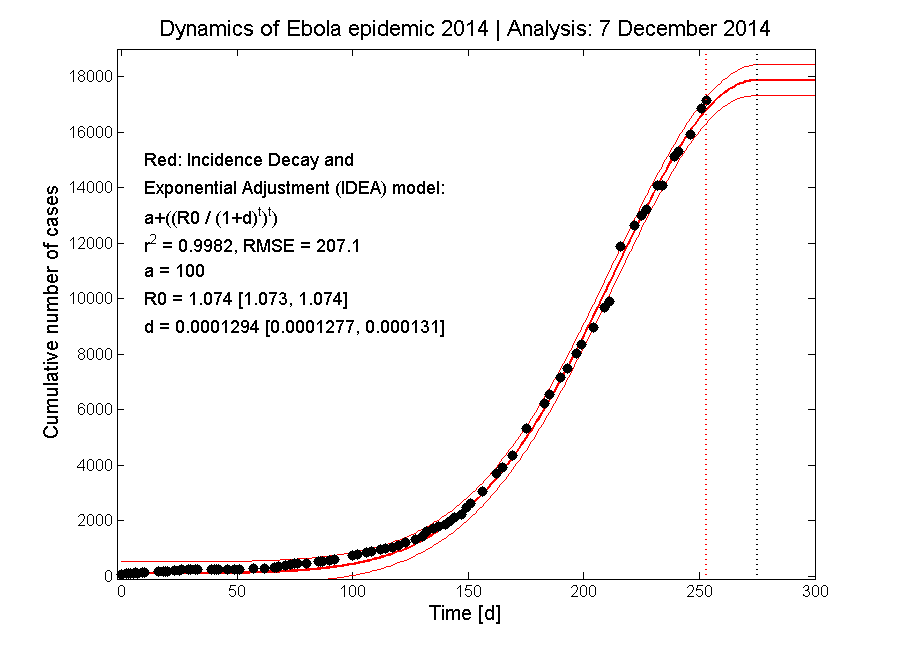
Update #31: 7 December 2014 | New prediction.
→ Predicted maximum: January 2015, max. cases: 17800 +- 600.
→ Predicted maximum: January 2015, max. cases: 17800 +- 600.
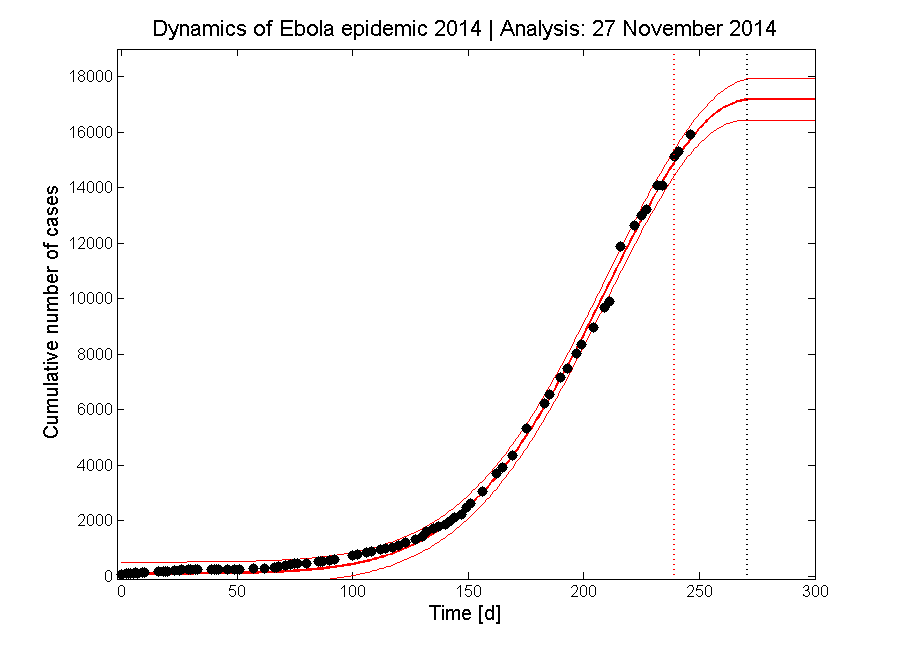
Update #30: 27 November 2014 | New data added to the prediction of 20 Nov. 2014 (Update #29)
→ Two new data points were released which follow the prediction quite nicely.
→ Two new data points were released which follow the prediction quite nicely.
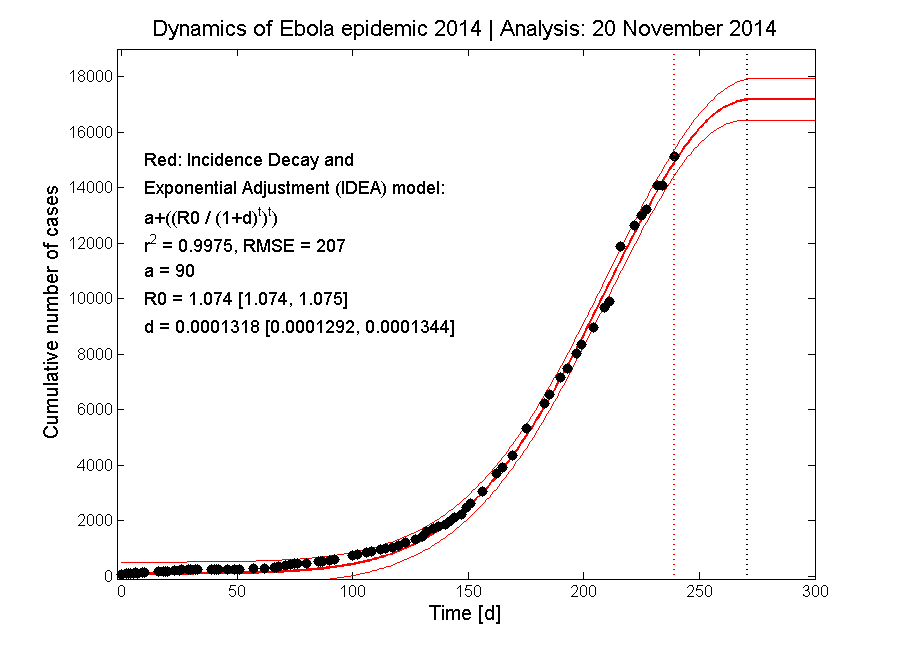
Update #29: 20 November 2014 | New prediction.
→ Predicted maximum (17000 +- 800 cases): end of December 2014. The cause of the discontinuity in the data (19 to 21 Oct) is still not known and the new fitting now treats this discintinuity as (random) scattering of the data.
→ Predicted maximum (17000 +- 800 cases): end of December 2014. The cause of the discontinuity in the data (19 to 21 Oct) is still not known and the new fitting now treats this discintinuity as (random) scattering of the data.
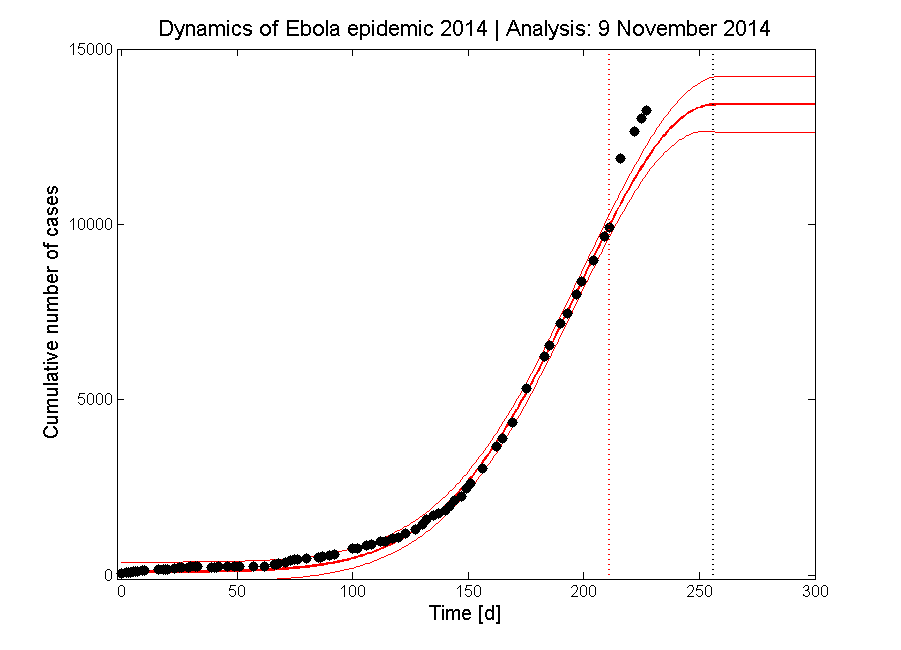
Update #28: 9 November 2014 | New data added to the prediction of 23 Oct. 2014 (Update #23)
→ The new data released by the WHO include corrections to previous numbers (the corrections starts at 25 August 2015). Now, the last foure data point seem to folow a linear trend at first approximation. Why there is an abrupt change in numbers from 19 to 21 Oct is still nor clear.
→ The new data released by the WHO include corrections to previous numbers (the corrections starts at 25 August 2015). Now, the last foure data point seem to folow a linear trend at first approximation. Why there is an abrupt change in numbers from 19 to 21 Oct is still nor clear.
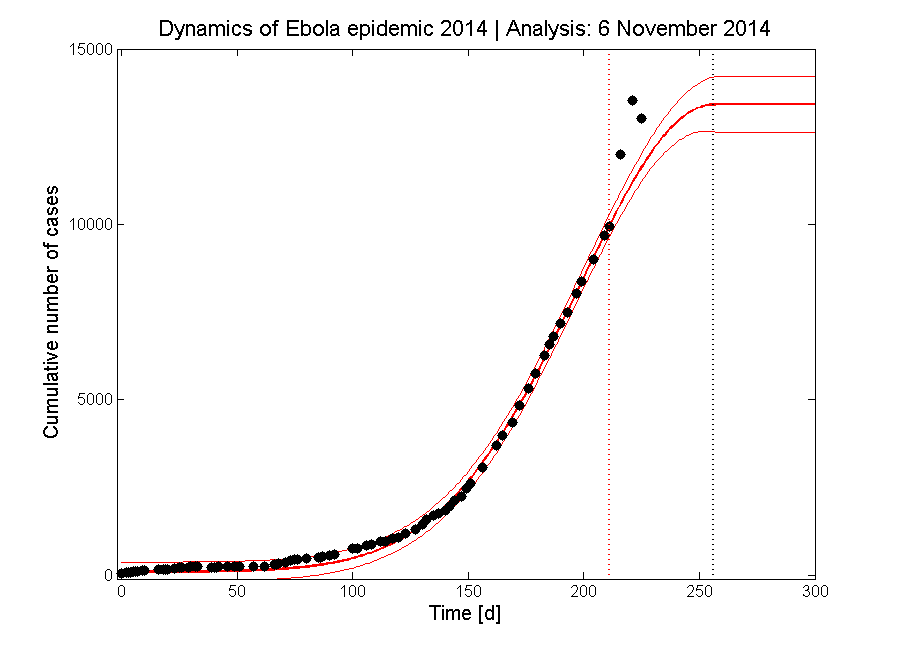
Update #27: 6 November 2014 | New data added to the prediction of 23 Oct. 2014 (Update #23)
→ The new data released (13015 cases, 2 Nov) is below the value of the last data release (13540 cases, 29 Oct). There is now a serious problem with the data seince the last three releases.
→ The new data released (13015 cases, 2 Nov) is below the value of the last data release (13540 cases, 29 Oct). There is now a serious problem with the data seince the last three releases.
Update #26: 31 October 2014 | New data added to the prediction of 23 Oct. 2014 (Update #23)
→ The new data released are also (as the previous one) outside the prediction. Either the new data are incorrect, or the old one ares erroneous - or the model is wrong. I think the discrepancy between the new numbers and the old ones relies on previous under-reporting of cases - or on a over-reporting of new casese due to difficulties in distinguishing Ebola from similar diseases (e.g. malaria). This makes the modelling difficult.
→ The new data released are also (as the previous one) outside the prediction. Either the new data are incorrect, or the old one ares erroneous - or the model is wrong. I think the discrepancy between the new numbers and the old ones relies on previous under-reporting of cases - or on a over-reporting of new casese due to difficulties in distinguishing Ebola from similar diseases (e.g. malaria). This makes the modelling difficult.

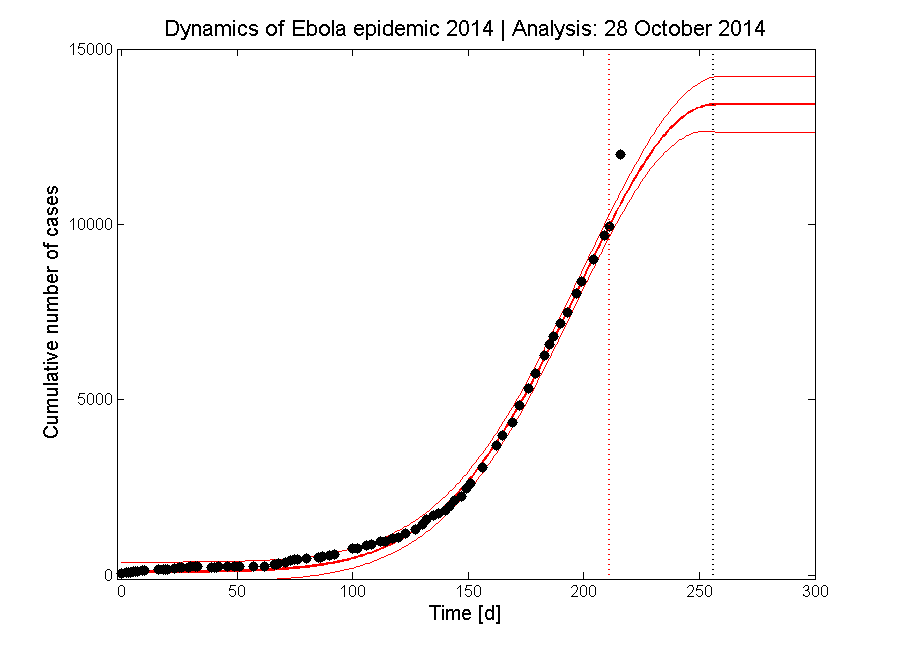
Update #25: 28 October 2014 | New data added to the prediction of 23 Oct. 2014 (Update #23)
→ Today the previous data (10141, 23 Oct) was corrected and the new data (12008 cases, 24 Oct) was released by the WHO. This new data now looks like an outlier and it is outside the prediction bounds. How could it be that there is such a strong increase in a few days? Or are the new data erroneous? Is there a kind of phase transition in the epidemics? We will see.
→ Today the previous data (10141, 23 Oct) was corrected and the new data (12008 cases, 24 Oct) was released by the WHO. This new data now looks like an outlier and it is outside the prediction bounds. How could it be that there is such a strong increase in a few days? Or are the new data erroneous? Is there a kind of phase transition in the epidemics? We will see.
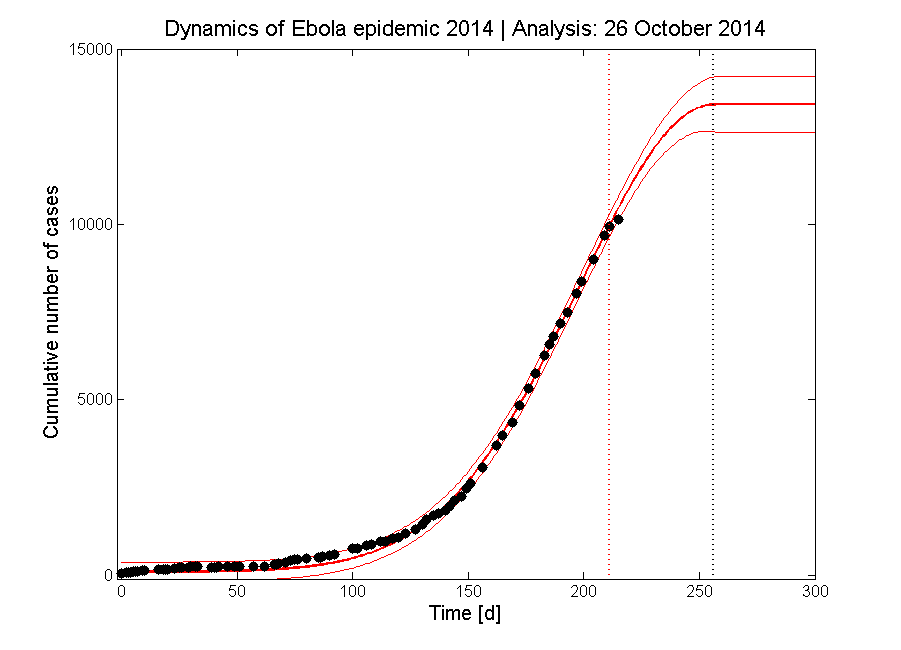
Update #24: 26 October 2014 | New data added to the prediction of 23 Oct. 2014 (Update #23)
→ Significant decrease in the growth rate. Of course, this could be due to a decline in the Ebola infections as well as due to unreported cases - it is a combination of both. Let's see what the following numbers will be.
→ Significant decrease in the growth rate. Of course, this could be due to a decline in the Ebola infections as well as due to unreported cases - it is a combination of both. Let's see what the following numbers will be.
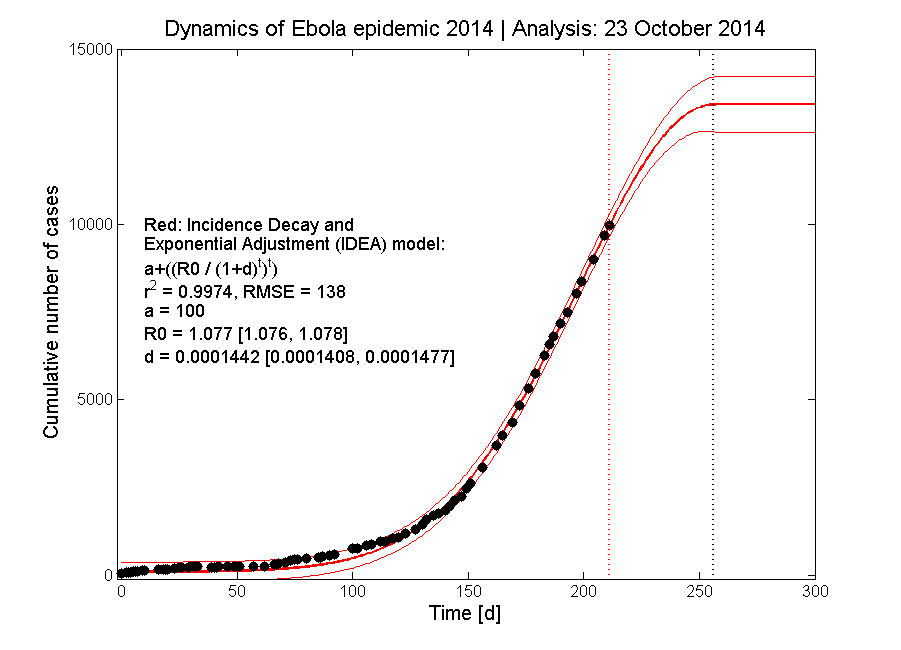
Update #23: 23 October 2014 | New preditions based on new data release.
→ Logistic model: no stable solution for the fitted function.
→ Modified IDEA model (i.e. fitting with IDEA model, after maximum: constant cumulative number of cases): good agreement between data and model. Expected maximum: December 2014 with 13000 ± 800 cases, i.e. in January 2014 the will be no more new cases (according to the prediction).
Update #22: 23 October 2014 | New preditions based on new data release.
→ Logistic model: no stable solution for the fitted function.
→ IDEA model: good agreement between data and model. Expected maximum: December 2014 with 13000 ± 800 cases.
→ Logistic model: no stable solution for the fitted function.
→ IDEA model: good agreement between data and model. Expected maximum: December 2014 with 13000 ± 800 cases.

Update #21: 22 October 2014 | New preditions based on new data release.
→ Logistic model: no stable solution for the fitted function.
→ IDEA model: good agreement between data and model. Expected maximum: December 2014 with approx. 13000 cases.
→ Logistic model: no stable solution for the fitted function.
→ IDEA model: good agreement between data and model. Expected maximum: December 2014 with approx. 13000 cases.

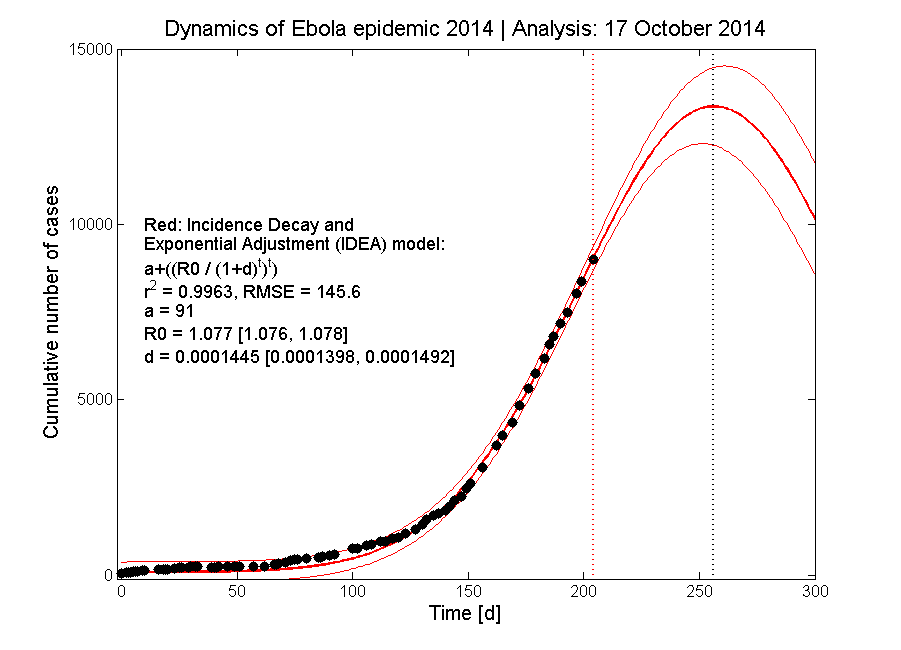
Update #20: 17 October 2014 | New preditions based on new data release.
→ Logistic model: no stable solution for the fitted function.
→ IDEA model: good agreement between data and model. Expected maximum: December 2014 with approx. 13000 cases.
→ Logistic model: no stable solution for the fitted function.
→ IDEA model: good agreement between data and model. Expected maximum: December 2014 with approx. 13000 cases.
Note | I am currently travelling and have no access to my mathematical analysis software and so I cannot update the predictions. On Friday I will be back and update the predictions.
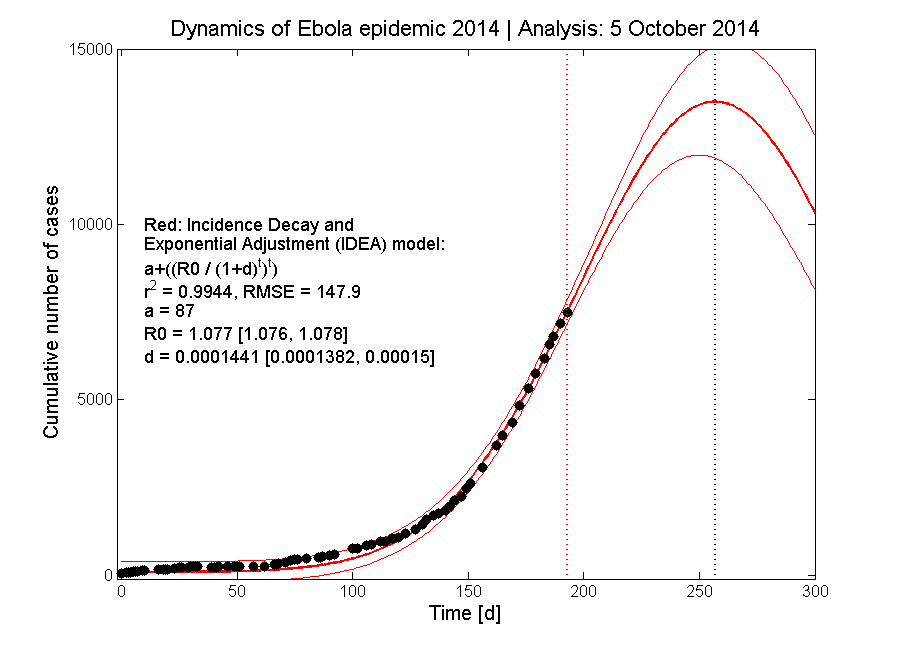
Update #19: 5 October 2014 | New preditions based on new data release.
→ Logistic model: no stable solution for the fitted function.
→ IDEA model: good agreement between data and model. Expected maximum: December 2014 with approx. 14000 cases. Since the last two data point: decrease in acceleartion.
→ Logistic model: no stable solution for the fitted function.
→ IDEA model: good agreement between data and model. Expected maximum: December 2014 with approx. 14000 cases. Since the last two data point: decrease in acceleartion.
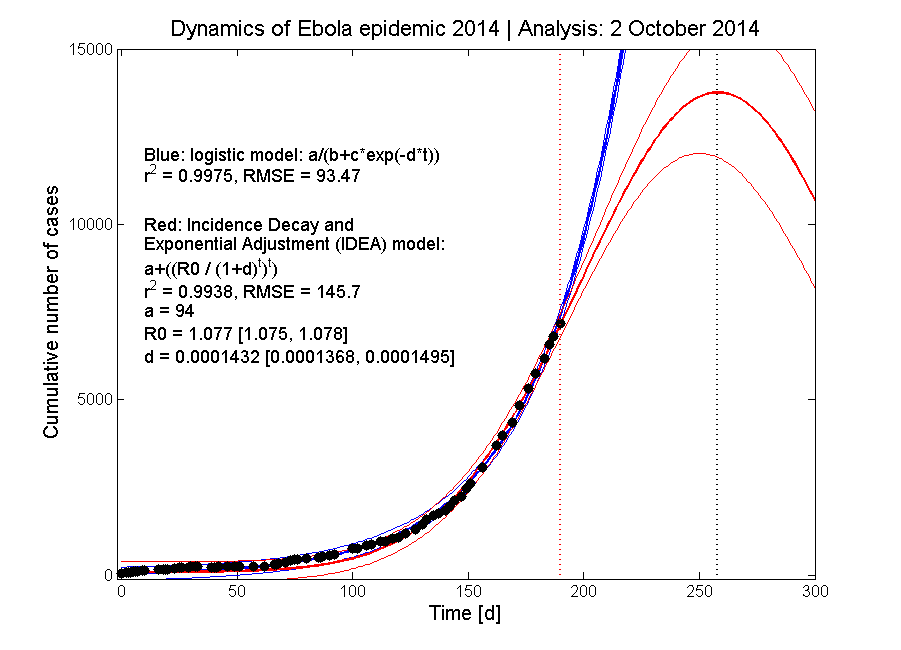
Update #18: 2 October 2014 | New preditions based on new data release.
→ Logistic model: good agreement between data and model. But the fit is getting worser ... a sign for an decrease in the acceleartion of the cumulative number of cases?
→ IDEA model: good agreement between data and model. Expected maximum: December 2014 with approx. 14000 cases.
→ Logistic model: good agreement between data and model. But the fit is getting worser ... a sign for an decrease in the acceleartion of the cumulative number of cases?
→ IDEA model: good agreement between data and model. Expected maximum: December 2014 with approx. 14000 cases.
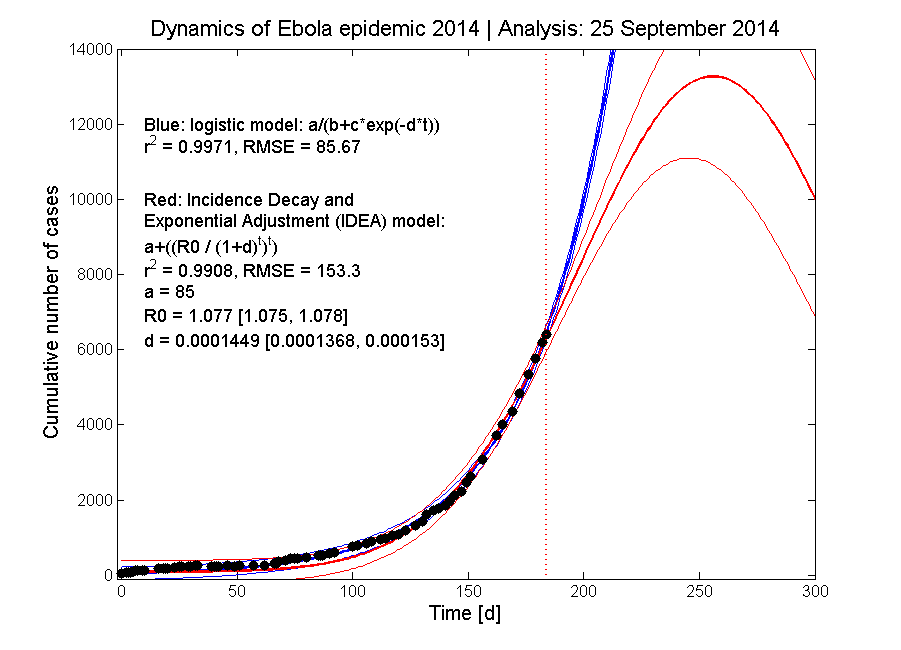
Update #17: 25 September 2014 | New preditions based on new data release.
→ Logistic model: good agreement between data and model.
→ IDEA model: good agreement between data and model. Expected maximum: December 2014 with approx. 13000 cases.
→ Logistic model: good agreement between data and model.
→ IDEA model: good agreement between data and model. Expected maximum: December 2014 with approx. 13000 cases.
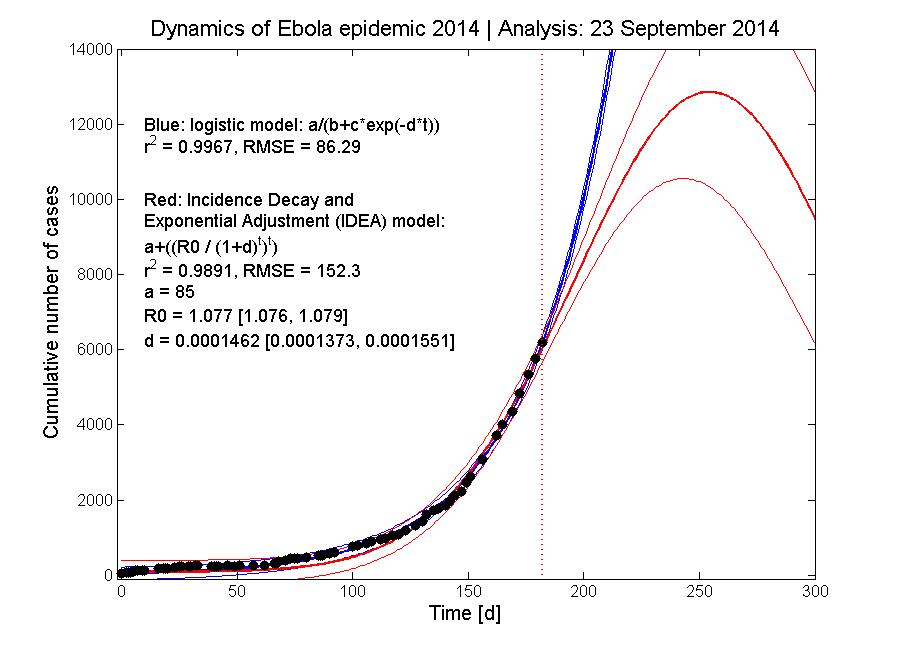
Update #16: 23 September 2014 | New preditions based on new data release.
→ Logistic model: good agreement between data and model.
→ IDEA model: good agreement between data and model. Expected maximum: December 2014 with approx. 12000-13000 cases. The last data point used in Update #15 was updated, now the number is higher and there is no decline in acceleartion anymore.
→ Logistic model: good agreement between data and model.
→ IDEA model: good agreement between data and model. Expected maximum: December 2014 with approx. 12000-13000 cases. The last data point used in Update #15 was updated, now the number is higher and there is no decline in acceleartion anymore.
Update #15: 22 September 2014 | New preditions based on new data release.
→ Logistic model: good agreement between data and model.
→ IDEA model: good agreement between data and model. Expected maximum: December 2014 with approx. 11000 cases. Compared to the previos prediction there seems now to be a decrease in the infection rate acceleartion. It will be interesting so seen if this decrease continues. The next two data releases will clearify this issue.

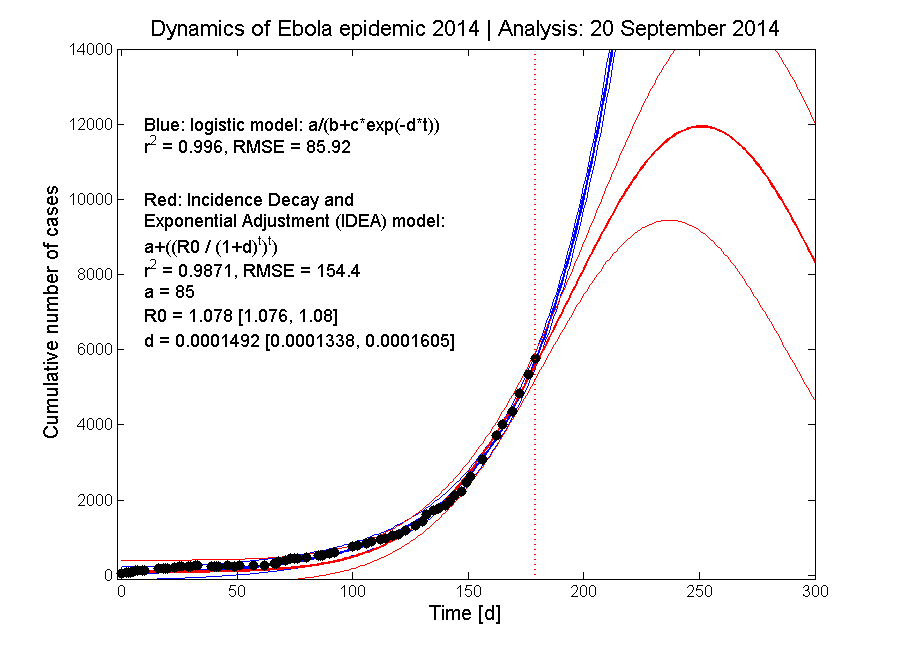
Update #14: 20 September 2014 | New preditions based on new data release.
→ Logistic model: good agreement between data and model.
→ IDEA model: good agreement between data and model. Expected maximum: December 2014 with approx. 12000 cases.
→ Logistic model: good agreement between data and model.
→ IDEA model: good agreement between data and model. Expected maximum: December 2014 with approx. 12000 cases.
Update #13: 18 September 2014 | New preditions based on new data release.
→ Logistic model: good agreement between data and model.
→ IDEA model: good agreement between data and model. Expected maximum: late November 2014 with 10000-11000 cases.
→ Logistic model: good agreement between data and model.
→ IDEA model: good agreement between data and model. Expected maximum: late November 2014 with 10000-11000 cases.

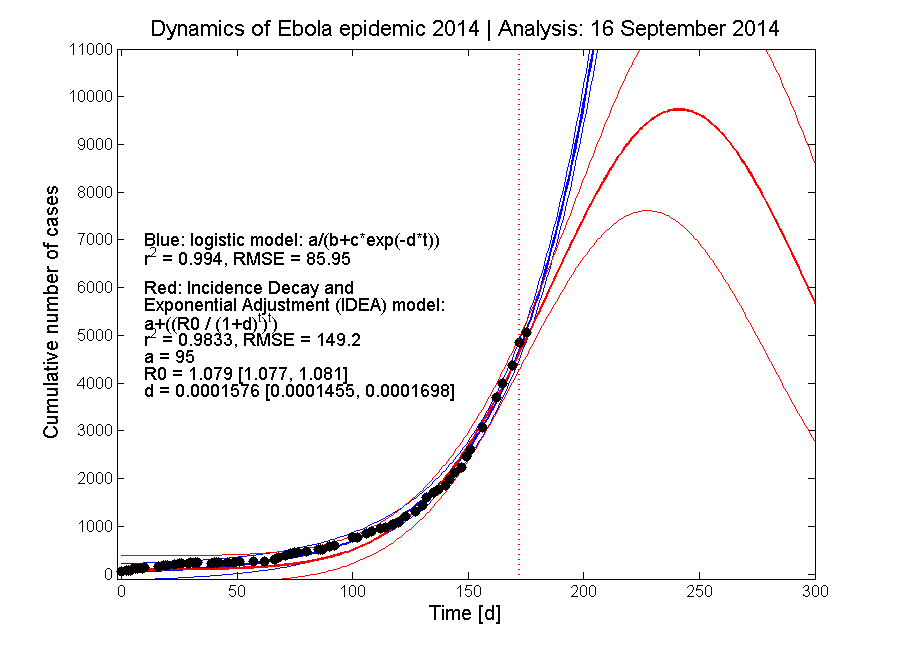
Update #12: 16 September 2014 | Comparison of prediction (14 Sept 2014) with new data.
→ Logistic model: good agreement between data and model.
→ IDEA model: good agreement between data and model.
→ Logistic model: good agreement between data and model.
→ IDEA model: good agreement between data and model.
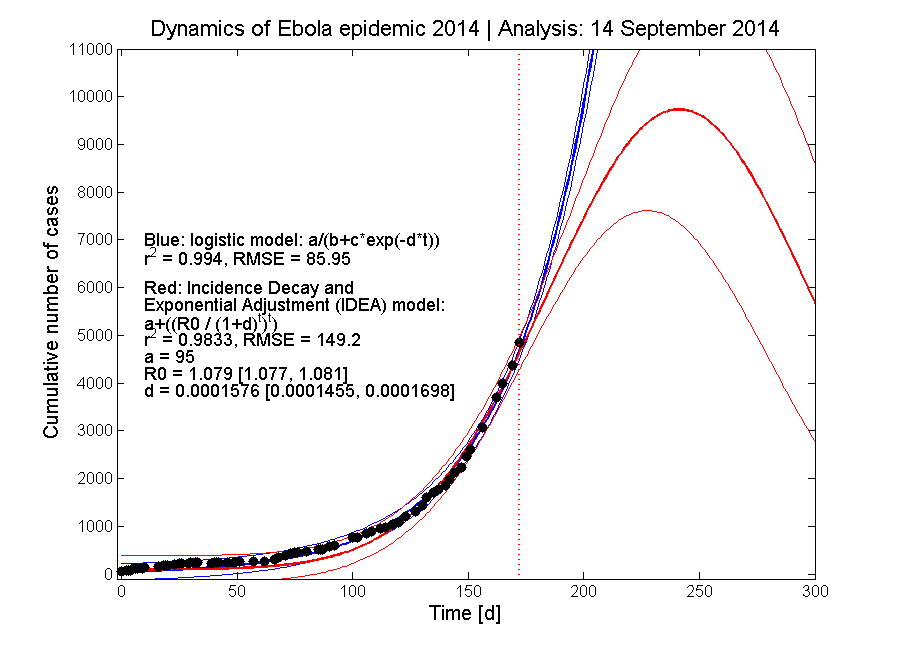
Update #11: 14 September 2014 | New preditions based on updated old data and new data released.
→ Logistic model: good agreement between data and model.
→ IDEA model: good agreement between data and model. The maximum is expected to occur in November 2014 with 9000-10000 cases.
→ Logistic model: good agreement between data and model.
→ IDEA model: good agreement between data and model. The maximum is expected to occur in November 2014 with 9000-10000 cases.
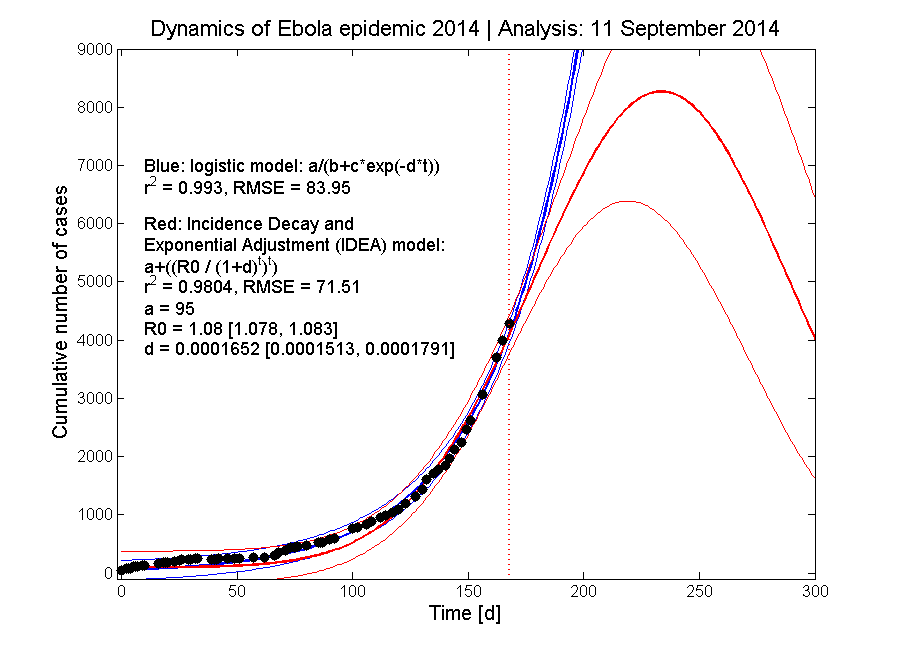
Update #10: 11 September 2014 | New preditions based on updated old data and new data released. In addition, the fitting procedure (i.e. estimation of the erro bounds) was optimized.
→ Logistic model: good agreement between data and model.
→ IDEA model: good agreement between data and model. The maximum is expected to occur in November 2014 with approx. 8000 cases.
→ Logistic model: good agreement between data and model.
→ IDEA model: good agreement between data and model. The maximum is expected to occur in November 2014 with approx. 8000 cases.
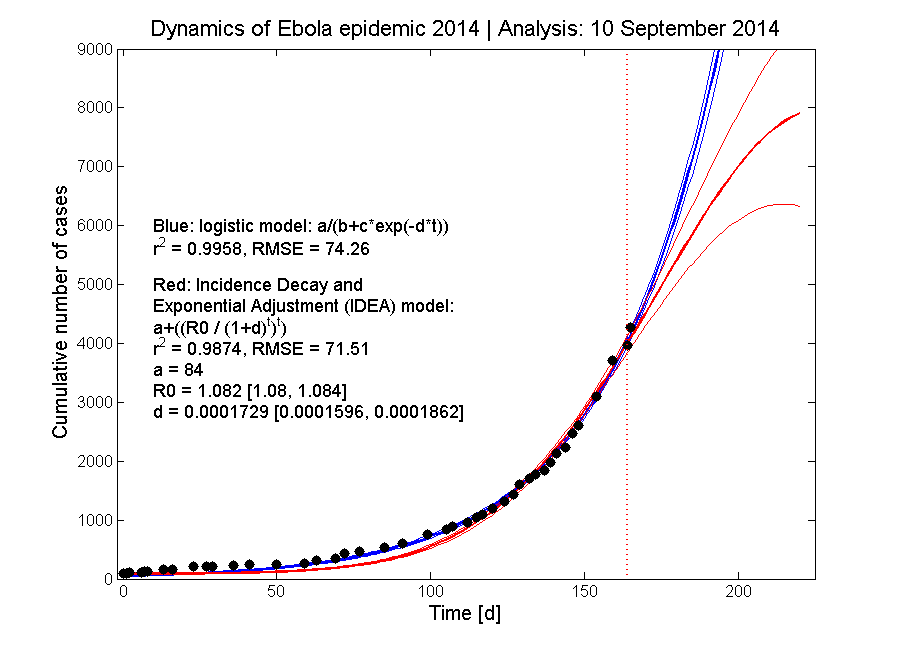
Update #9: 10 September 2014 | New preditions based on new data released.
→ Logistic model: good agreement between data and model.
→ IDEA model: good agreement between data and model. To optimize the data fitting the original IDEA equation was slightly modified by adding a constant term (offset) (a). Note: for the fitting the actual time instead of the "serial interval time" (as in the original IDEA model paper) is used. This changes the interpretation of the parameters R0 and d, but does not change the mathematical behaviour of the model.
The maximum is now expected to occur in November 2014.
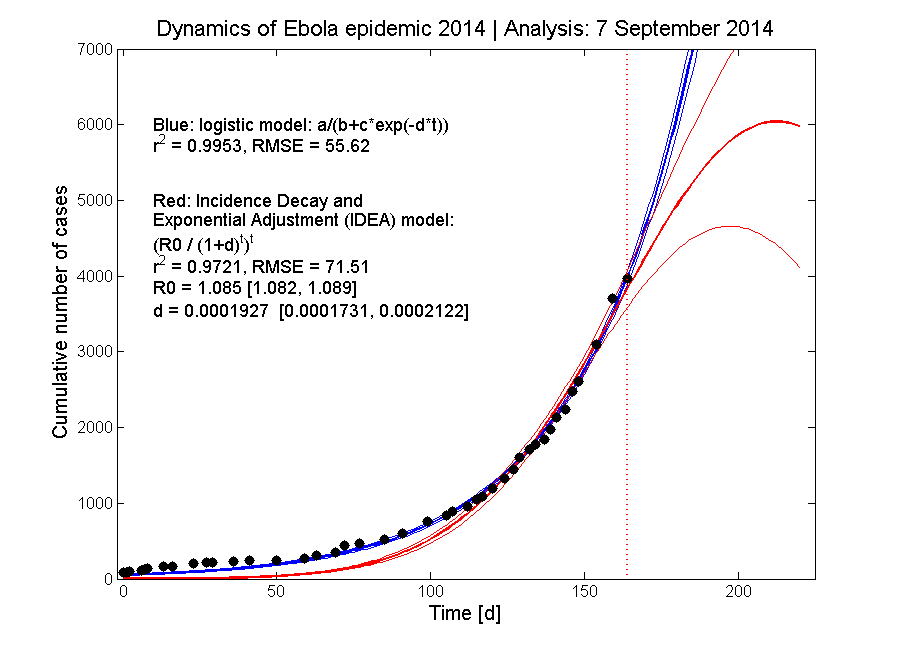
Update #8: 7 September 2014 | Comparison of new data with new preditions based on the logistic and IDEA model.
→ Logistic model: describes the actual data quite good. IDEA model: also good agreement, prediction of maximum: middle of October 2014. R0 = 1.085, d = 0.0001927
→ Logistic model: describes the actual data quite good. IDEA model: also good agreement, prediction of maximum: middle of October 2014. R0 = 1.085, d = 0.0001927
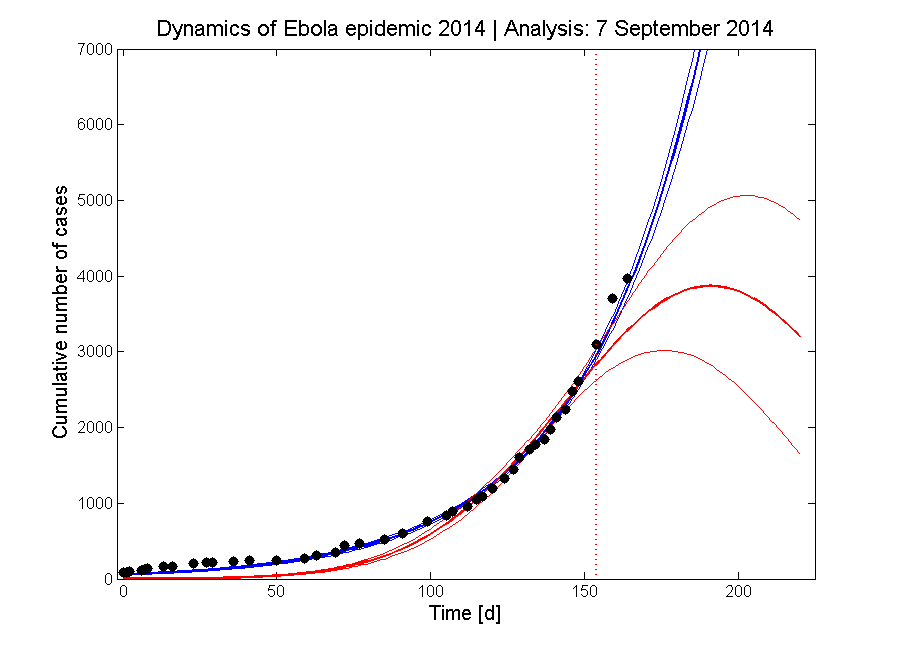
Update #7: 7 September 2014 | Comparison of new data with preditions done by 28 August 2014
→ Logistic model: describes the actual data quite good. IDEA model: large deviation between prediction and actual data
→ Logistic model: describes the actual data quite good. IDEA model: large deviation between prediction and actual data
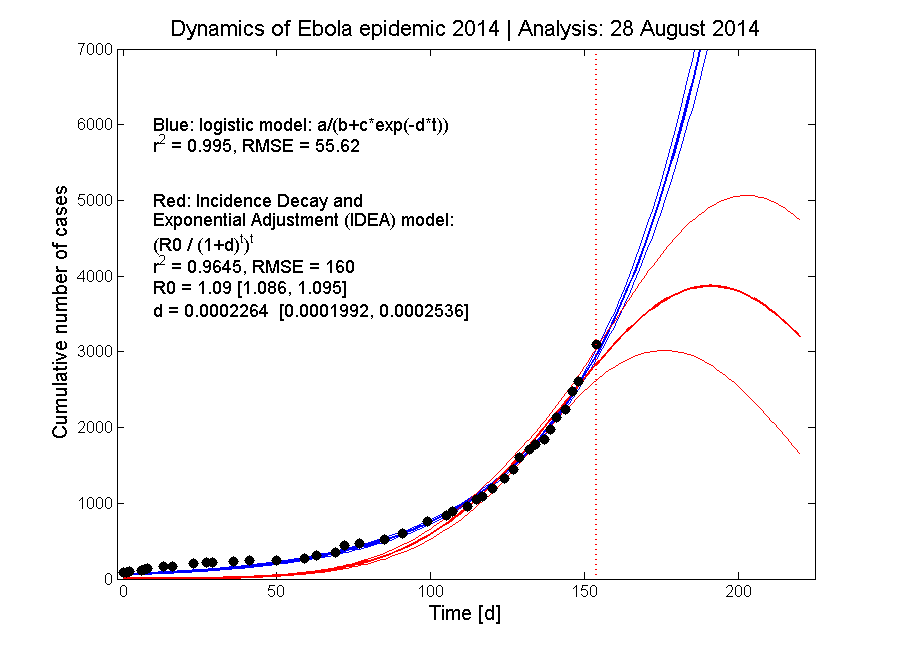
Update #6: 23 August 2014 | Comparison of new data with predition done by 23 August 2014 and optimization of the fit parameters + new prediction with the Incidence Decay and Exponential Adjustment (IDEA) model (Fisman et al., PLoS ONE 8(12): e83622)
→ Logistic model: describes the actual data quite good. IDEA model: predicts the maximum of the epidemic in approx. 50 days. R0 = 0.9645, d = 0.0002264
→ Logistic model: describes the actual data quite good. IDEA model: predicts the maximum of the epidemic in approx. 50 days. R0 = 0.9645, d = 0.0002264
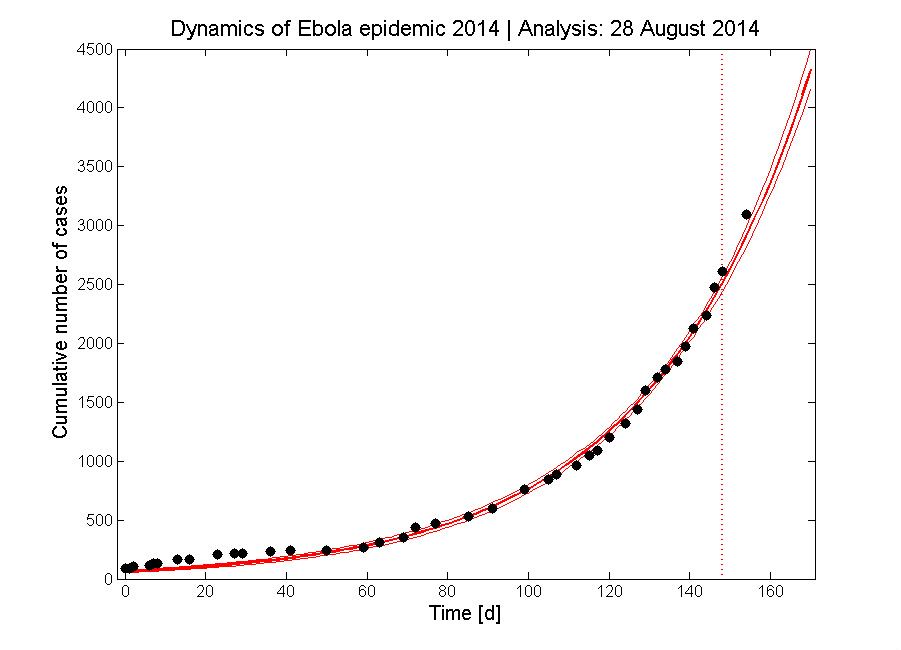
Update #5: 28 August 2014 | Comparison of new data with predition done by 23 August 2014
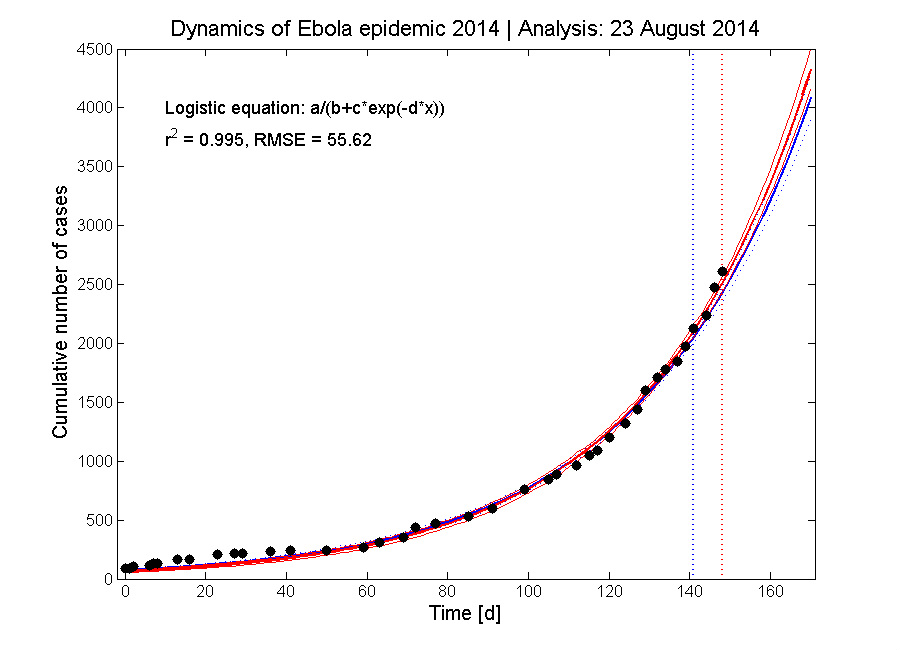
Update #4: 23 August 2014 | Comparison of new data with predition done by 17 August 2014 and optimization of the fit parameters
→ New fitting of the logistic equation to the data (red: new fit, blue: old fit as of 17 August 2014)
→ New fitting of the logistic equation to the data (red: new fit, blue: old fit as of 17 August 2014)
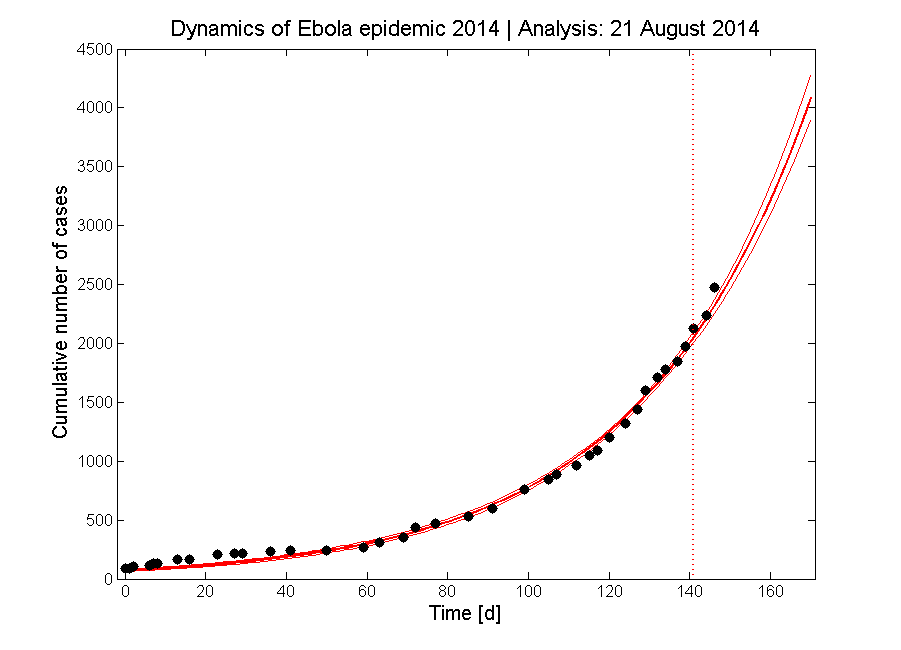
Update #3: 21 August 2014 | Comparison of new data with predition done by 17 August 2014
→ The actual number of cases is slightly higher as predicted
→ The actual number of cases is slightly higher as predicted
Update #2: 20 August 2014 | Comparison of new data with predition done by 17 August 2014
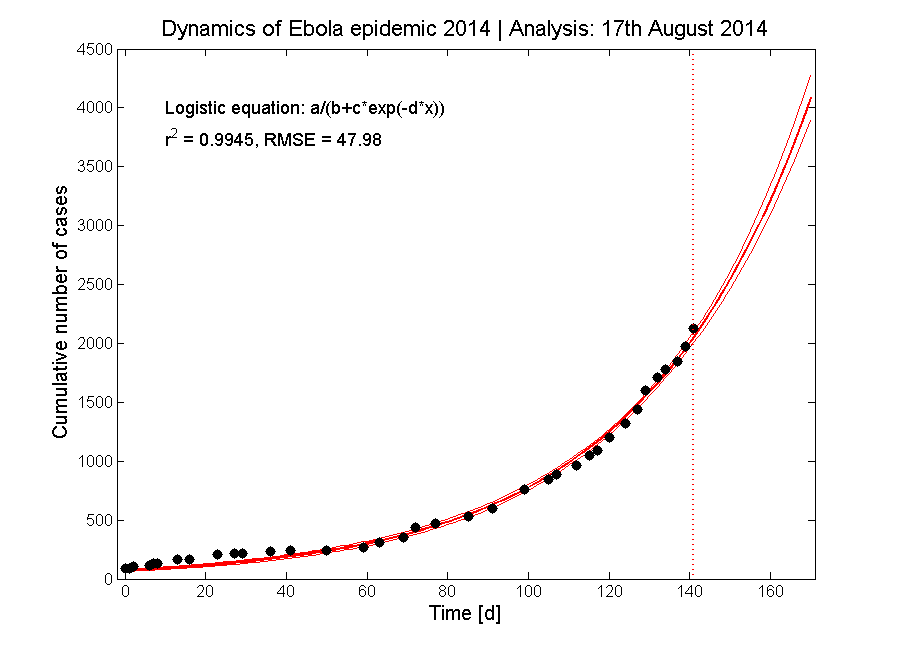
→ Correct prediction of the new data. The exponential increase continues
→ Correct prediction of the new data. The exponential increase continues

Analysis #1: 17 August 2014